In the ropeway sector, statistical data continue to be scarcely curated or shared with operators, generally with differences from country to country.
For over 20 years, quota neve has published Italian statistics on ropeway installations for passenger tran-sport built in the previous year, featured in the January–February issue. These statistics are not absolute but are considered reliable, important, and of interest. They are not absolute because quota neve, lacking an official status, cannot compel anyone to respond. This does not diminish the initiative’s value: better incomplete data than none at all.
To avoid double entries for the same installation in two different years, checks are made to ensure that an installation has not already appeared in previous annual lists. Since 2000, the initiative has expanded to an international, practically global scope. The criteria used by quota neve in Italy are applied internationally. The following installation data are collected: location, name, type, cabin capacity, vertical rise, length, and hourly capacity.
As stated, the focus is on passenger transport installations, excluding low-rope mini-lifts, télécordes, and conveyors due to their specific characteristics, as well as material transport systems and inclined elevators, which follow very different standards.
Data were collected from direct or indirect statements by manufacturers and/or from known and accessible statistics. The vast majority of global production is dominated by a few Alpine manufacturers, and having their data is sufficient for the initiative’s validity. The two major Alpine groups also control nearly the entire North American market.
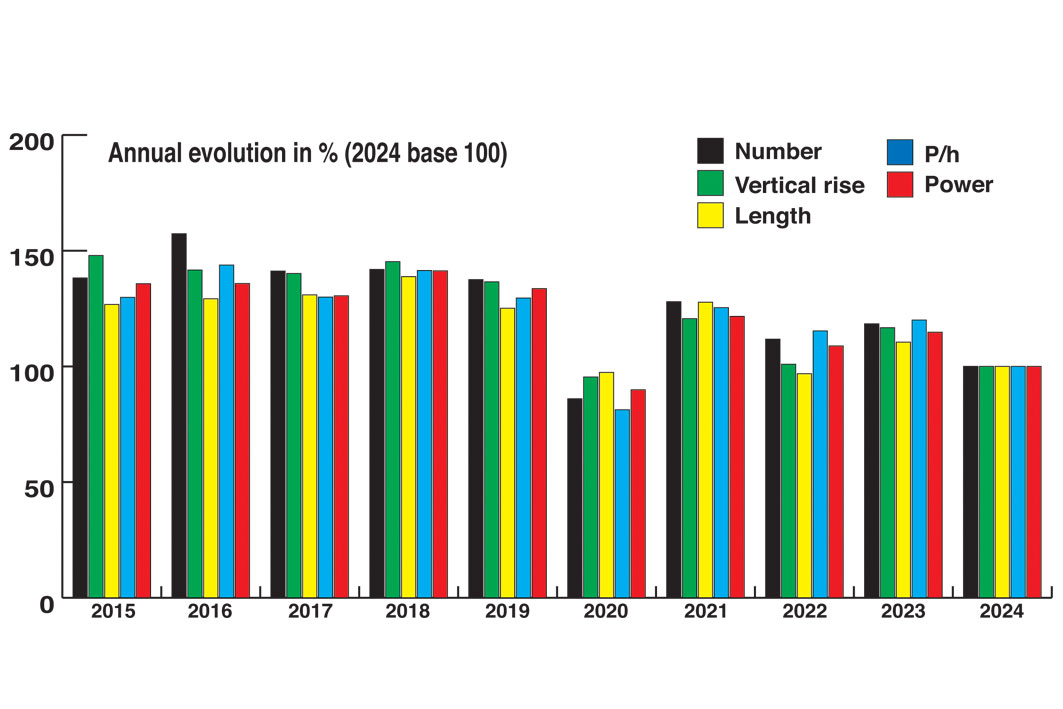
For global coverage, there are gaps in Japan, China, Russia, and India, which remain quite isolated in the ski area sector. Given these gaps, we prefer to speak of a global data collection rather than strict statistics. The ropeway installations identified as newly built for passenger transport in 2023 total 136 (161 in 2023, 152 in 2022, 172 in 2021, 117 in 2020, 187 in 2019, 193 in 2018, 192 in 2017, 214 in 2016, 188 in 2015, 166 in 2014; 223 in 2013, 197 in 2012, 218 in 2011, 216 in 2010, 203 in 2009, 215 in 2008, 257 in 2007, 357 in 2006, 334 in 2005, 310 in 2004, 270 in 2003, 254 in 2002, 239 in 2001 e 312 in 2000), with a total transport capacity of 91 million m/h (105 in 2023, 99 in 2022, 106 in 2021, 82 in 2020, 122 in 2019, 129 in 2018, 119 in 23017, 124 in 2016, 124 in 2015,112 in 2014,128 in 2013, 101 in 2012, 118 in 2011, 126 in 2010, 116 in 2009, 116 in 2008, 155 in 2007, 200 in 2006, 188 in 2005, 159 in 2004, 161 in 2003, 147 in 2002, 131 in 2001 e 161 in 2000), a total vertical rise of 42 km (49 in 2023, 43 in 2022, 50 in 2021, 40 in 2020, 58 in 2019, 61 in 2018, 59 in 2017, 60 in 2016, 63 in 2015, 54 in 2014; 65 in 2013, 54 in 2012, 58 in 2011, 68 in 2010, 57 in 2009, 63 in 2008, 77 in 2007, 103 in 2006, 99 in 2005, 82 in 2004, 76 in 2003, 75 in 2002, 66 in 2001 e 90 in 2000), a total length of 183 km (203 nel 2023, 178 in 2022, 234 in 2021, 117 in 2020, 230 in 2019, 255 in 2018, 240 in 2017, 221 in 2014; 237 in 2016, 233 in 2015, 252 in 2013, 211 in 2012, 234 in 2011, 262 in 2010, 217 in 2009, 237 in 2008, 292 in 2007, 400 in 2006, 423 in 2005, 319 in 2004, 301 in 2003, 278 in 2002, 246 in 2001 e 339 nel 2000), total hourly capacity of 274,000 pph (329 in 2023, 316 in 2022, 336 in 2021, 223 in 2020, 355 in 2019, 388 in 2018, 356 in 2017, 394 in 2016, 355, nel 2015, 324 nel 2014; 395 nel 2013, 341 nel 2012, 375 in 2011, 374 in 2010, 374 in 2009, 361 in 2008, 466 nel 2007, 622 nel 2006, 567 nel 2005, 523 nel 2004, 515 in 2003, 458 in 2002, 419 in 2001 e 507 in 2000).
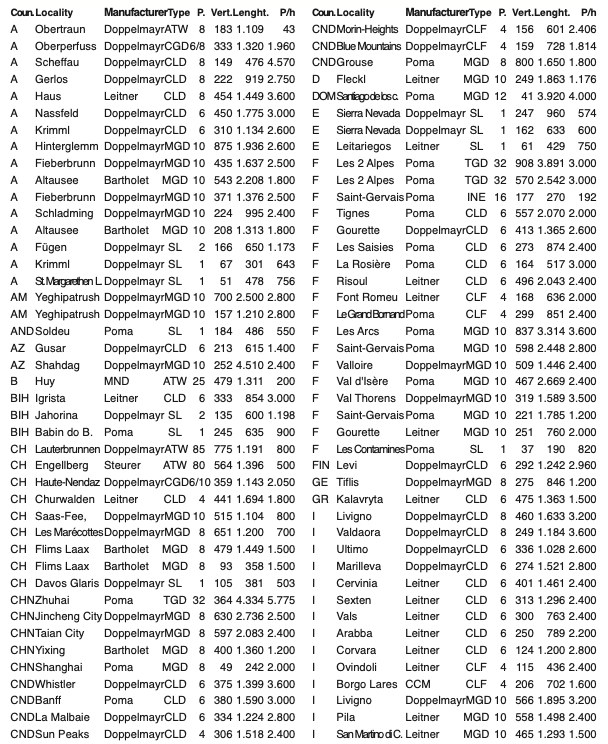
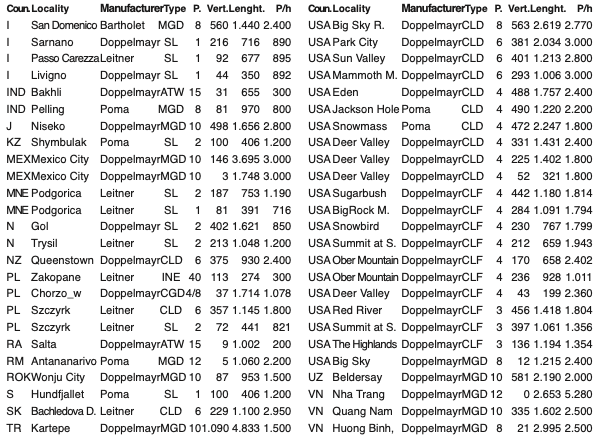
All 136 installations identified as built in 2023 are listed at the end of the article.
The main data sources were: annual corporate publications presenting the installations completed in the reference year (Doppelmayr, Leitner, Poma); the Italian statistics compiled by quota neve mentioned above; and information from international specialized media and the websites of individual manufacturers. This ensures almost systematic coverage for Alpine countries, where few manufacturers besides the main ones are active in public passenger transport with notable market relevance. A growing reluctance by smaller manufacturers to publish their achievements has been observed. For other countries, local manu-facturers are known but play a marginal role globally and do not participate in major trade fairs.
In the spirit of “better partial data than none,” we believe this analysis offers valuable and indicative insights, especially as it remains the only one of its kind worldwide and likely covers more than 90–95% of the market.
Another issue concerns the accuracy of the data: being company-sourced, they may be “optimistic,” sometimes unintentionally. This is mentioned as a reminder to interpret the data cautiously.
Tables and graphical representations are developed using various criteria: number of installations, vertical rise, length, hourly capacity, and power (or transport potential, calculated as hourly capacity × vertical rise for each installation). This approach is chosen because the debate on the most valid criterion for evaluating total values remains open.
The number of installations is the simplest metric, but treating a beginner ski lift as equivalent to a gondola with a 1,000-meter rise and several thousand people per hour capacity is questionable. In ski lift systems, transport power or potential, calculated as vertical rise multiplied by hourly capacity, makes sense since it reflects the energy (vertical drop) available to skiers; however, for flat or urban systems with little or no elevation change, length and hourly capacity may be more logical indicators.
Given these complexities, no single parameter has been prioritized over others: readers are invited to determine which aspect they find most significant. In some graphs (by country or manufacturer, for example), the bar heights representing various aspects tend to balance out within each category. This is not the case for installation types, as surface lifts are structurally very different from reversible aerial tramways in terms of vertical rise and length, just as they differ from detachable systems in hourly capacity.
Since the values (number, vertical rise, length, hourly capacity, and power) vary widely, tables and charts use percentage values relative to each aspect’s total to allow comparisons across different metrics.
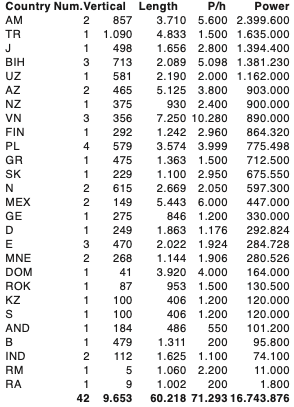
Countries
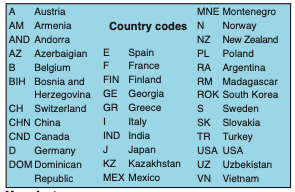
Countries are identified by vehicle license plate codes. Data and graphs focus on the four main Alpine countries, along with North America (NA) and China, as they account for about 70% of installations and over 80% of total power; although these percentages are gradually decreasing due to growth in other countries:
Manufacturers
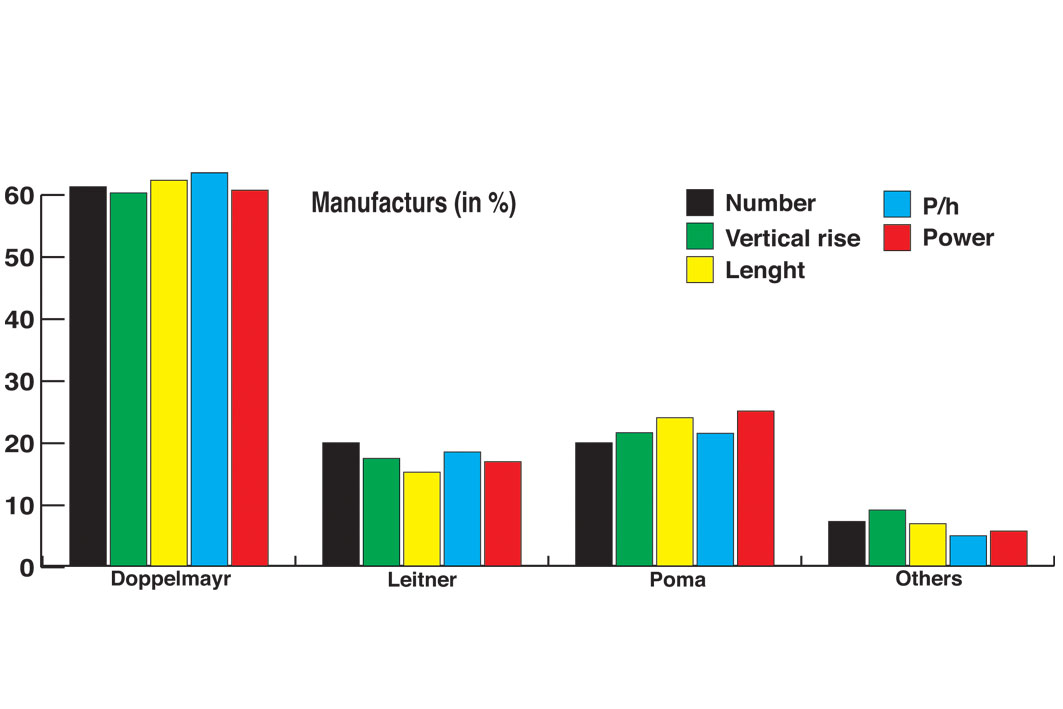
The graphs highlight totals for each aspect by major manufacturers, who account for about 90% of the production surveyed.
In 2022, the Doppelmayr Group further confirmed its clear leading position, with all indicators exceeding 50% of the total.
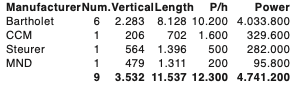
The other manufacturers identified are:
Types
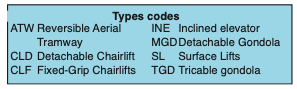
For 2024, the trend toward detachable systems is confirmed: particularly 6-seater chairlifts and 10-seater gondolas. These systems account for over 60% of all 2024 installations in number, and 86% in terms of transport power.
The 136 ropeways surveyed